Published Dec 18, 2024
API Management: The Monitor Phase

The monitor phase in API management focuses on tracking the performance and reliability of your APIs once your API consumers have started using them in their applications. Proactive monitoring helps maintain API stability, detect anomalies, and gain insights into usage patterns, ultimately enhancing the user experience and ensuring smooth API operations.
As a critical stage of full API lifecycle management, the monitor phase ensures that APIs remain resilient, scalable, and aligned with business needs long after they are deployed.
The 4 phases of the API Management Lifecycle are:
We’ll use an example use case of an ecommerce company, ACME Chocolatiers, to see how they could use Celigo’s API Management to monitor API performance, consumption, and availability through real-time analytics, logging, health checks, and notifications.
The monitor phase: API Management video overview
Analyzing API usage
Accessing dashboard overview
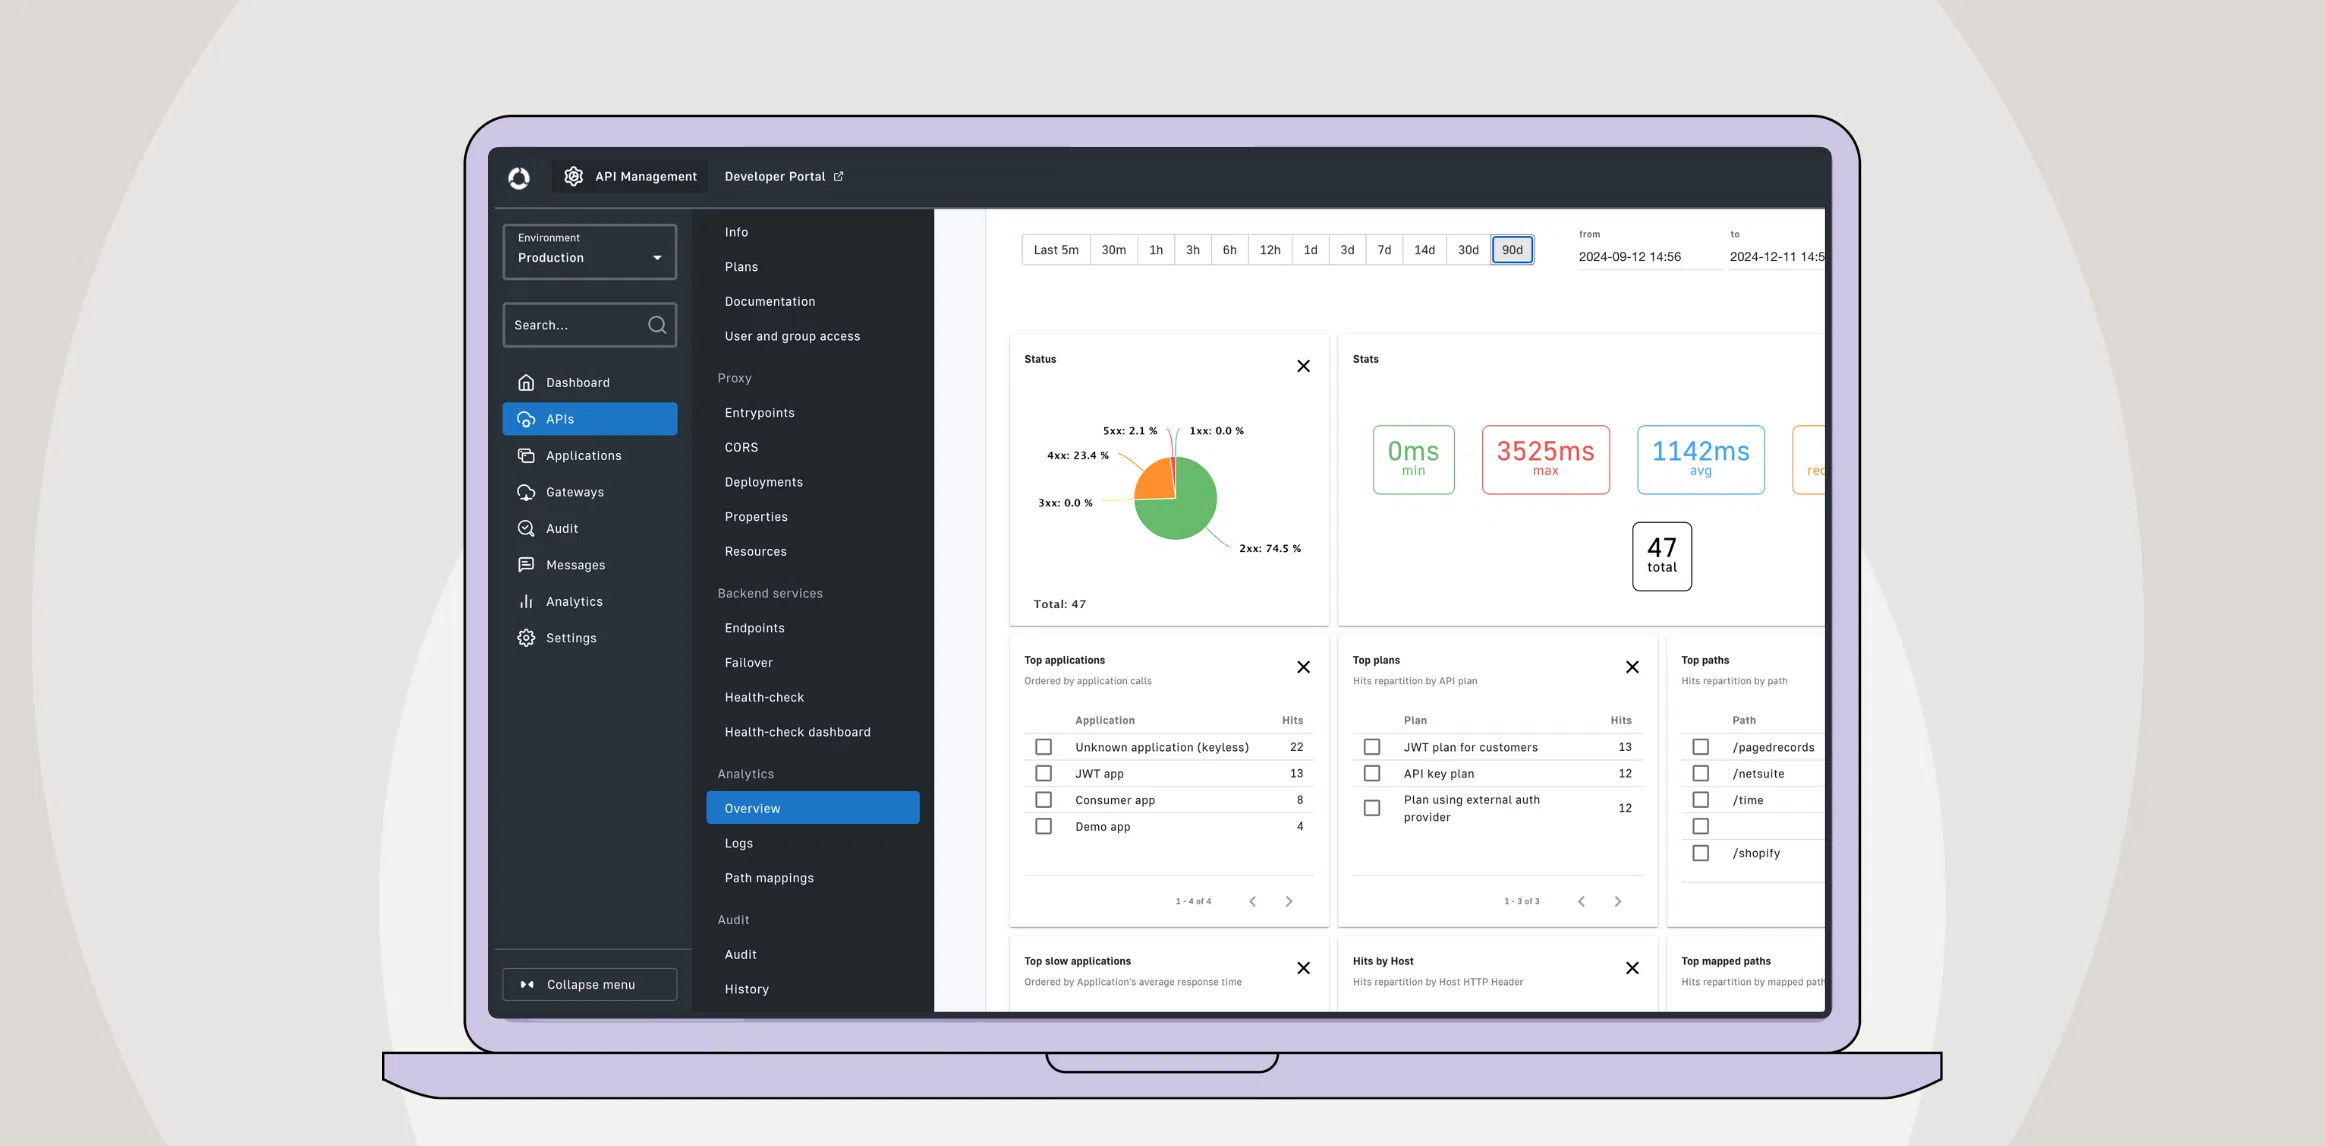
From the API management console, the dashboard provides a quick snapshot of API activity and health, showing metrics like lifecycle states, response statuses, and top-performing APIs. The dashboard allows users to adjust the time frame and view data to track API activity over different periods, making it easier to identify trends or spot issues.

Customizing the dashboard
While this Dashboard Overview page is not customizable, you can easily create custom dashboards to gain deeper, more specific insights tailored to your needs. Customizing dashboards allows businesses to track the metrics that matter most. For instance, let’s say ACME Chocolatiers wants to monitor the response size of an API.
By adding a widget that tracks “response content length” to the API dashboard, ACME can get a real-time view of the data volume being transferred, which can highlight potential bottlenecks or performance issues.
Dashboards can be created to monitor individual APIs, the entire platform, or even specific applications, each offering unique metrics that cater to different monitoring needs:
- Platform dashboard: Displays aggregated metrics for all APIs in the platform for an environment.
- API dashboard: Provides metrics specific to an individual API.
- Application dashboard: This dashboard displays usage metrics for a specific application, allowing API consumers to view analytics in the developer portal.

You can also edit pre-configured dashboards by adding or removing widgets, providing flexibility to adjust the information displayed according to your organization’s monitoring goals.
Analyzing API-level metrics
To monitor an individual API’s performance, the API dashboard provides a breakdown of its usage by status codes, application, and more. This granular view allows organizations to understand what are the different status codes for the API, and how different applications interact with the API, for the given duration.
For example, if an application consistently generates error responses, you can investigate further to determine the root cause and make necessary improvements.

The dashboard’s time series graph enables users to filter by status code, allowing them to detect patterns in error responses. If there’s a spike in errors for a particular endpoint, Rate limiting or Quota policies may need to be adjusted to prevent overloading the API.
Viewing API analytics in the Developer Portal
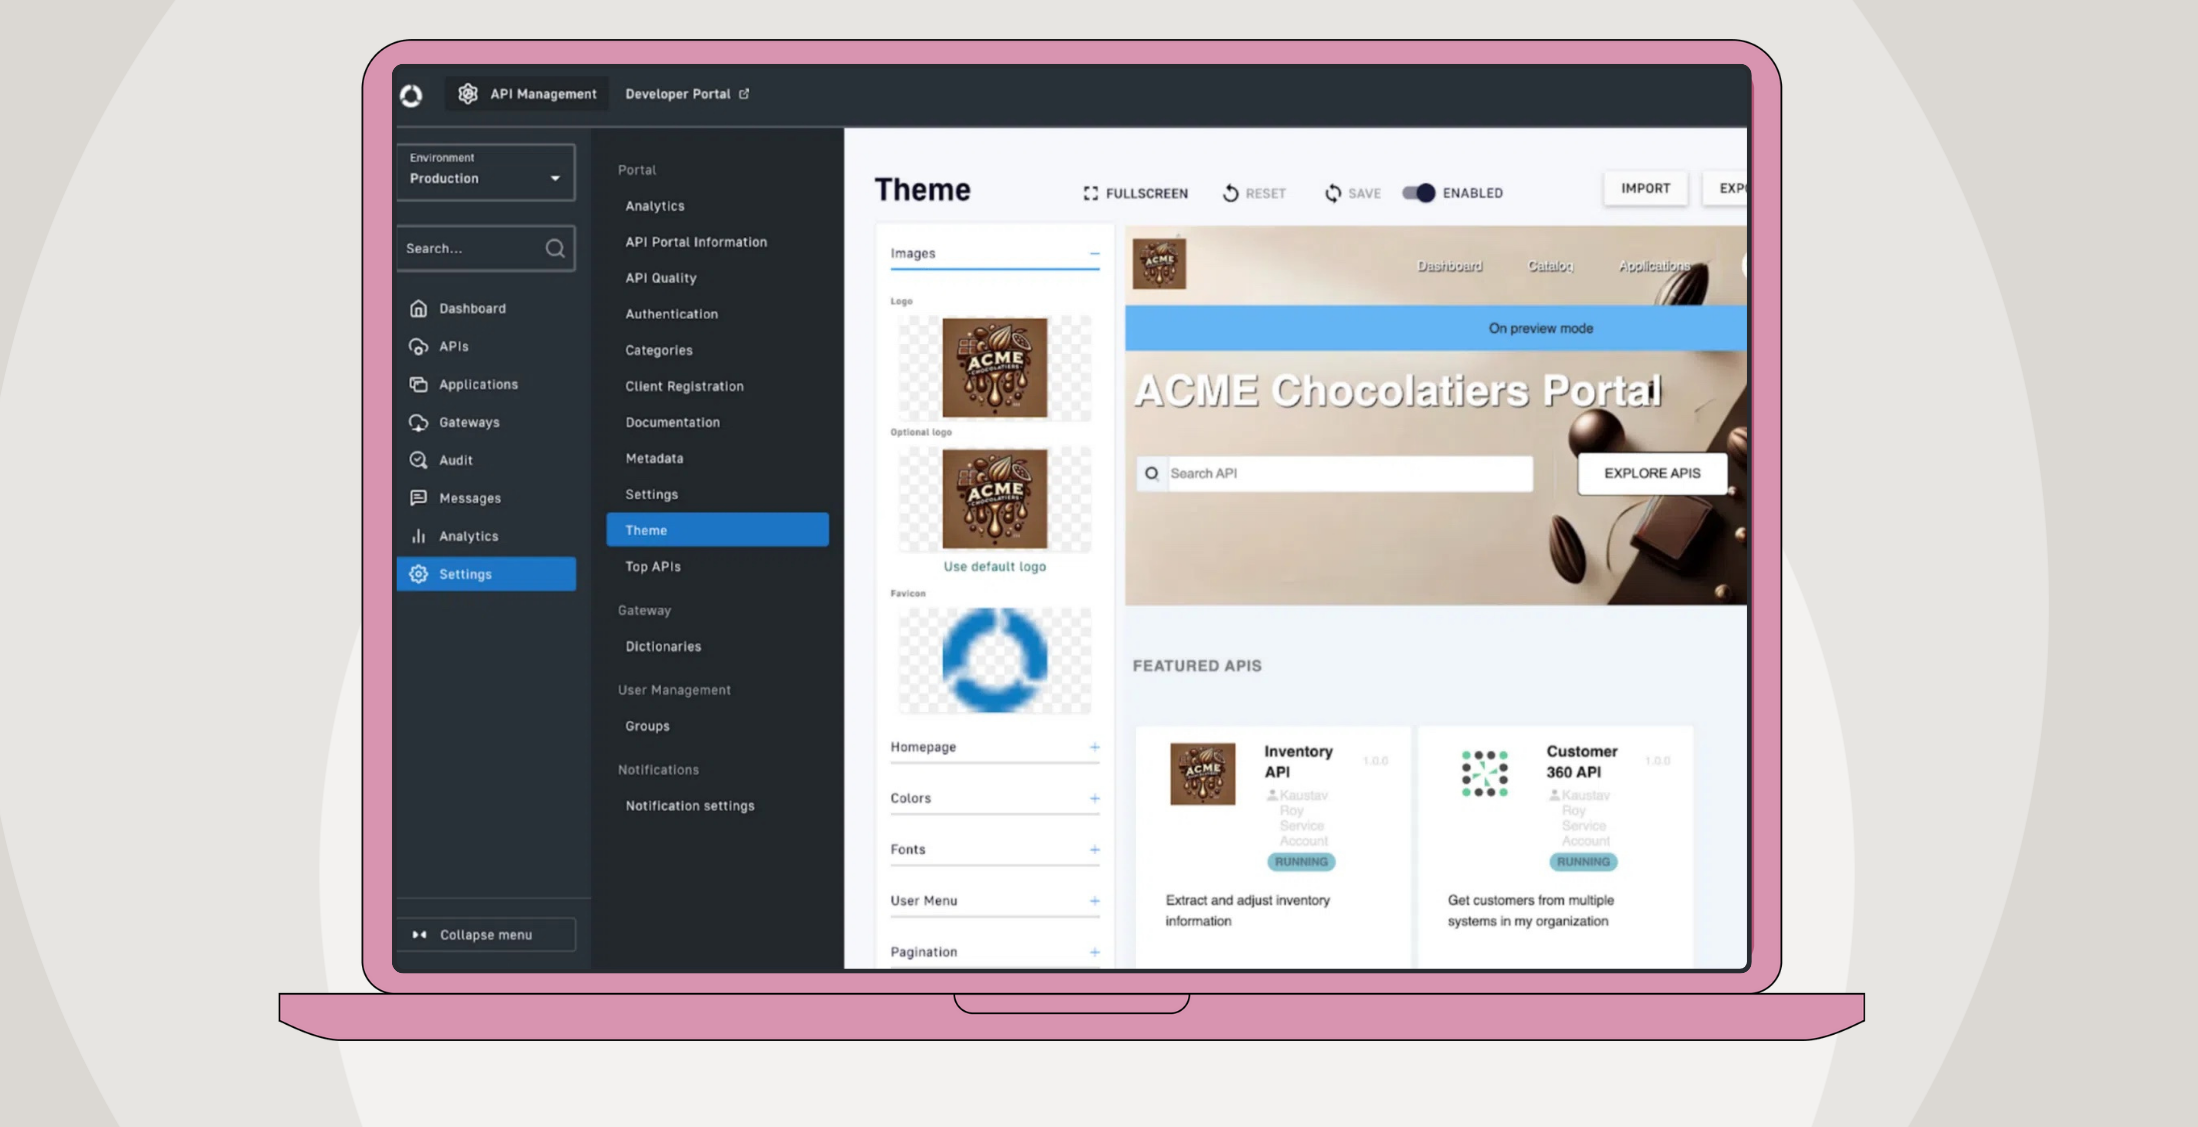
API analytics are also available to consumers within the Developer Portal. This allows developers to use the API to access metrics for their applications, providing transparency and aiding in troubleshooting. API consumers can view call counts, response times, and error trends, which helps them understand how their applications interact with the API and optimize their usage patterns.
Monitoring API logs for detailed insights
Logs are a valuable resource for debugging and troubleshooting, as they provide a historical record of API requests. Users can apply filters to view logs for specific requests or errors, helping to pinpoint issues quickly. Basic logging is shown by default, including the API request’s timestamp, response status and duration, application making the API request, and so on.

Logging can be configured to view detailed information of headers or payloads, request or response, or any combination of these. While logging is essential for troubleshooting, it’s generally recommended to enable extensive logging only during development and testing to minimize performance impact.
Configuring health checks for API availability
To ensure your APIs remain available 24×7, health checks can be configured in the API management console. A health check periodically calls an API endpoint to verify that it’s operational. Configuring a health check involves setting a trigger frequency, specifying an HTTP method, and adding an authorization header.
If the API becomes unavailable, the health check dashboard will alert administrators, allowing them to address issues before they impact API consumers.
Viewing audit trails for configuration management
When multiple users manage APIs within the console, audit trails provide a detailed record of configuration changes. This feature allows administrators to view past configurations when API behavior changes, compare changes, and roll back to previous states if necessary. The platform-level Audit logs give a comprehensive view of activity across APIs, adding an additional layer of governance and accountability.
Receiving Notifications
Timely alerts are crucial for responding to important API events. The API management console supports three types of notifications:
- Portal notifications: Displays alerts within the developer portal, such as subscription acceptances or API key expiration notices, keeping API consumers informed.
- Email notifications: Sends alerts to specific email addresses, including your API management service account, for events requiring immediate attention.
- Webhook notifications: Sends HTTP POST requests to a designated URL, triggering external processes or integrations in response to API events.

These notifications ensure that relevant stakeholders are promptly informed about any changes or issues, helping organizations maintain control over their API environment.
Maintaining the reliability and performance of APIs
The monitor phase in API management is essential for maintaining API reliability and performance. With dashboards, analytics, and logging, companies like ACME Chocolatiers can watch their APIs like hawks (or maybe a chocolate connoisseur eyeing a fresh batch of truffles) and thereby gain real-time visibility into API usage and health, ensuring that any issues are addressed swiftly. Health checks and notifications provide proactive monitoring capabilities, while audit trails ensure configuration integrity and accountability.
Integration insights
Expand your knowledge on all things integration and automation. Discover expert guidance, tips, and best practices with these resources.


